Friday, December 14, 2012

A Culture of Unconditional Acceptance

It happens once and we have room to blame it on the instability of a single individual. It happens twice and we have grounds to attribute the problem to access to guns. It happens three times and we look for similarities. We then might deduce that psychotropic drugs are to blame. It happens five times in one year and consistently for as long as it has and at some point we have to face the fact that there is something very wrong with our culture.

I can't sleep tonight. I have two daughters, one in second grade and one who will enter kindergarten next year and I can't help but think that tonight there are twenty parents staring at presents under the Christmas tree that will go unopened, stockings that will go unstuffed next week, and beds that lie empty. I can't fathom the dwarfing sense of loss these parents must feel, it hurts too much to fully empathize. And the lingering question on everyone's mind is, "Why?"

I think of the unconditional love I have for my own children and then I think about how much we hear people talk about the value of unconditional love but how seldom we hear anyone speak of unconditional acceptance. Now it is too early to know specifics about what happened this morning in Connecticut but we certainly know a lot about the other mass shootings we have suffered over what now is nearly a whole generation. I surmise that the common issue among all these tragedies stems from a culture that doesn't value or practice unconditional acceptance. Our culture in practice does the opposite. It sorts and exploits.

A. S. Neill believed that children only have two basic needs, they need play to learn and unconditional love and acceptance to nurture. He also believed that discipline is an expression of self hate of which the victims become the haters. With the numbers of people in our prisons it is hard not to conclude we are a culture of discipline. Now, take someone who has been pushed to the edges of society, labeled, clinically diagnosed, medicated and deny them the unconditional acceptance they need to be emotionally stable and they will exhibit antisocial and even destructive behaviors. I saw this consistently on a smaller basis in alternative schools. However, take a person in that fragile state and show them that you support them and accept them unconditionally and they begin to build the psychic foundation they need to get better. This is true for both children and adults. But, that is not the culture we live in.

Our culture ranks and sorts people through standardized tests, special needs assessments, tax brackets, and social standing. Our culture relies on clinical analysis of test results to treat everything from heart disease to anxiety disorders and depression. Instead of treating the human being we treat the patient. Our standards of measurement have turned people into objects. We watch the exploitation of those most consider different on The Learning Channel (TLC):  Here Comes Honey Boo Boo, My 600 lb Life, The Little People, Hoarders, Extreme Couponing, all teaching us to view those who are not "normal" as something other than the kind of human being the rest of us are. We numb our sense of horror by watching violent television shows and playing violent first-person shooter games which also reinforce this notion that some people are objects. Once we accept a clinical diagnosis that proclaims someone different from us it is not that hard to accept a wrong-headed view that they are somehow less human. In all previous mass shootings the gunmen exhibited a pathology that indicates they may have felt this kind of objectification, this kind of ostracizement.

We like to talk about unconditional love for our children. We like to talk about acceptance and tolerance with regard to race, religion, or sexual preference, but we never talk about unconditional acceptance or what a culture built upon love and unconditional acceptance might look like.  To build such a culture we would need to eliminate clinical diagnosis that breaks us down and categorizes us. We would need to eliminate sources of rank and file within our institutions. We would need to move from a society that disciplines to one that nurtures. We would need to deschool society. To do so would heal so many mental illnesses and help prevent the sort of tragedy that happened today. While I look down on my daughters as they sleep in their beds tonight, overwhelmed with unconditional love for them, I hope that somehow I can instill in them an unconditional acceptance of all people. And I hope that that unconditional acceptance can spread, permeate the culture. If you change the environment you change behavior, if you change the culture you change the environment.

Thursday, December 13, 2012

The Farce in Numbers Project #edchat #artchat #digitalart

I think it was David Warlick who I first heard say, "First we do old things in old ways, then we do old things in new ways, and finally we do new things in new ways." David was talking about new computer technologies but I believe the axiom holds true for art as well.

I am currently teaching a Senior Digital Arts class at the Perpich Center Arts High School.  In that class I started by having students build online portfolios for their work.  We spent a couple days playing around with HTML then spent a day testing out numerous free WYSIWYG editors evaluating them to choose a platform that would fit the students' individual visions. The second week I had the students using digital painting and photo editing tools to create digital paintings and merged digital photos. These three assignments were examples of doing old things in new ways but I am interested in leading these students to explore how they might expand the definition of digital art. I want them to begin doing new things in new ways.

After gaining skill and competence in digital imaging tools I asked the students to apply those skills in a larger inquiry project. I began this unit while they were still working on their previous assignments. Without telling them it was part of the course I played Marshal McLuhan's The Medium is the Massage. I wanted McLuhan's recording to work them over and seep in through their skin. To my surprise they really enjoyed the hour-long broken spoken word hodgepodge. This provided a nice way of building background for a conversation on the role of media and society which included more than just the observations of McLuhan but also Neil Postman and others and especially their relationship to where we find truth. Basically, I brought them through a philosophical dialog that I later summarized on my blog last week in my post We Live in a Make-Believe World.


The week-long inquiry project that came from this became material for the session, Design of the Times, Scott Schwister and I did at the TIES Conference this week. I asked students to locate resources that showed how graphs and charts can mislead then generate a list of these strategies.  I also asked them to look at color theory, word-image association, juxtaposition, and other aesthetic methods of influencing meaning and interpretation.  Their culminating assignment came from a graph makeover contest that was published in Forbes that week. The contest provided two different data sets and asked readers to submit graphs and infographics illustrating the data in an easier-to-consume format. My assignment for my students was slightly different. I asked them to take the data in the Forbes contest and lie with it, to use visual rhetoric to change the perception of the data without changing any of the numbers. Here are a few of their finished products along with the original data set from Forbes:

Raw Data:

Student Projects:

This visualization lies first by omitting the other data then by drawing our attention to the red we are made to feel the increase in entertainment spending associated with television yet the raw data makes no association. It would be interpreted very differently had she used ballet slippers or theater masks as the associational image. It also lies by hiding the most startling statistic in the table. The cost of health insurance which by contrast gives both homeowners and renters less money to spend on nearly every other spending category. Had this data been included it would beg the question why did entertainment spending increase while most other categories decreased.
This infographic  uses a simple trick to lie with data. By replacing bars with houses in this bar graph and manipulating their width the yellow house is made to seem much larger and therefore much more significant than it really is. This graph greatly exaggerates the difference between these figures without altering them.


These two images simply use size and proportion to represent the figures but it tells a few lies with the images it associates with the categories. For instance, "Food Away From Home" is represented with a bag of fast food implying that this statistic actually represents only fast food. Likewise, "Entertainment" is represented with a game controller thus influencing our interpretation of what entertainment means.  In fact, the exclusion of the words in these pieces misinform us leading us to rely only on the icons to derive meaning.

Now, this is not necessarily doing new things in new ways except that what my students did not know was that while they were doing this assignment they were also contributing to a crowdsourced art project of mine. Their next assignment will be to explore the emerging art form of crowdsourced art and organize their own crowdsourced art project using their Web Portfolios as a place to launch their project.


Tomorrow I will reveal this to them but today I had them watch the documentary Catfish, ending class with tomorrow's discussion question, "Was what Angela did with Facebook art?" We will spend about twenty minutes with this question tomorrow.  I suspect they will not reach consensus, my colleagues in the visual art department couldn't reach consensus when I posed the question to them. However, the point is not to reach consensus but to begin getting the students thinking about how we can do new things in new ways using digital media. I will also share a project I did at ISTE in Philadelphia and pose the same question to them. In that project I linked video recordings of keynotes and presentation sessions I wished had been at the conference to QR Codes, printed them on post-it notes, then put the post-its on the session banners around the conference. Arguably, I held my own education conference and had 18,000 attendees. Is this digital art?

After this "What is Art?/What is Digital Art?" discussion I will introduce the crowdsourced art project. Students will explore the work of Aaron Koblin and other artists working with this new emerging medium. Their assignment will be to devise and execute a crowdsourced art project. Now, our class officially ends next Friday but there will be a semester student exhibit in February in our gallery where some of these projects may appear as living contributable works of crowdsourced art. But, as a good art teacher I know I need to model what I want my students to do so I am announcing my own crowdsourced art project and I invite you to contribute. I invite students to contribute. I invite anyone and everyone to contribute.


The Farce in Numbers Project:

Using the data in the table from the Forbes Graph Makeover Contest posted above on homeowner and renter spending, create a data visualization, graph, or infographic that utilizes visual rhetoric to tell a lie. You may omit data but you may not change the numbers. Rely on color, image association, juxtaposition, and other visualization tools to misrepresent this data. Send your submissions to me either by posting a link in the comment section below or by emailing anderscj@yahoo.com. All contributions will appear on this page of the Design of the Times Wiki. All contributions will also be stitched together to create a large tapestry of lies told with data to be printed on a large canvas. The goal is to reach more than 1,000 contributions making the final piece at least 25 images high by 40 images wide. Multiple contributions are welcome.


Wednesday, December 12, 2012

Sal Khan, Teacher or Opportunist? #ties12 #edchat

Between the blizzard, my own sessions, and having to go back to school to teach Monday afternoon I didn't get to very many sessions at this year's TIES Conference. I did, however, manage to attend one session that has been bothering me enough to feel the need to write about it. Tuesday afternoon I attended a Q&A session with Sal Khan of Khan Academy.

I have largely avoided any critique of the Khan Academy on my blog because for the most part I have never seen any problem with the basic concept of having a catalog of tutorials that students can reference just as I have never seen any problem with having a class library. I also don't see any problem with the flipped classroom concept. In fact, I have used the flipped classroom model for professional development for the past five years and have often used it with my students. However, after attending this session I am left with a few serious issues with regard to KA.

First, Khan claims to have been the innovator who revolutionized teaching and learning through the flipped classroom but I know better. I first became aware of the idea of the Flipped Classroom from Karl Fisch, a technology coordinator and professor from Colorado, who had pioneered the idea with two high school science teachers, Jonathan Bergmann and Aaron Sams. According to Who.is www.khanacademy.org was first registered March 14, 2006. While it appears Khan, Jonathan, and Aaron all seemed to start "flipping" around the same time I know for a fact that the term is one the boys from Colorado coined. Besides, tools like TeacherTube and Screencast-o-matic have been around for quite some time, tools that offer and anticipated this kind of use in the classroom. So, perhaps we should also credit Lloyd Smith, who created TeacherTube on April 6th, 2006.

Second, the Khan Academy videos are simply recorded tutorials. They are no different than any other instructional video that pre-dates the Internet. What Khan does that the producers of most multimedia curriculum of yesterday didn't do was claim that this is teaching. Before the Q&A a video from 60 Minutes was shown where the journalist asks Khan if he is the most watched teacher in the world. Khan doesn't dispute that. But, this can only be true if teaching is the same as content delivery. We used to call the producers of such content curriculum developers or curriculum publishers, not teachers. The teacher who produces their own curriculum actually teaches with it. The curriculum is not the teaching. Khan Academy may be a nice resource to have but it is not a teacher any more than a book shelf is a teacher or a textbook is a teacher. Teaching involves much more than delivering information.

Third, in the 60 minute video there is an interview with Eric Schmidt, chairman of Google, where he says that we can't look to teachers working in the system for innovation, that we must look to outside sources for innovative solutions. He simply says, "That is not how innovation works." He doesn't qualify his remarks but speaks very dismissively of innovative attempts by educators. This is a basic propaganda technique meant to convince the public that private organizations and external non-profits are the answer and that anyone working within the system has bankrupt ideas. I find this enormously dishonest and incredibly offensive especially shown at a conference full of educators from around the Midwest who are being innovative. Every conference presenter at TIES who is a teacher showing an innovative method or strategy should be offended by this. Karl Fisch, Jonathan Bergman, and Aaron Sams should be offended by this.


Khan is not a teacher, he is a opportunist who when the stock market started to take a dive left his job as a hedge fund analyst to start a company. I suspect the only reason Khan Academy is a non-profit is he knew he would run into legal trouble claiming he invented the Flipped Classroom if it were a for-profit venture and besides, as a non-profit he can accept loads of Gates Foundation money.

Thursday, December 6, 2012

Medieval Infographics

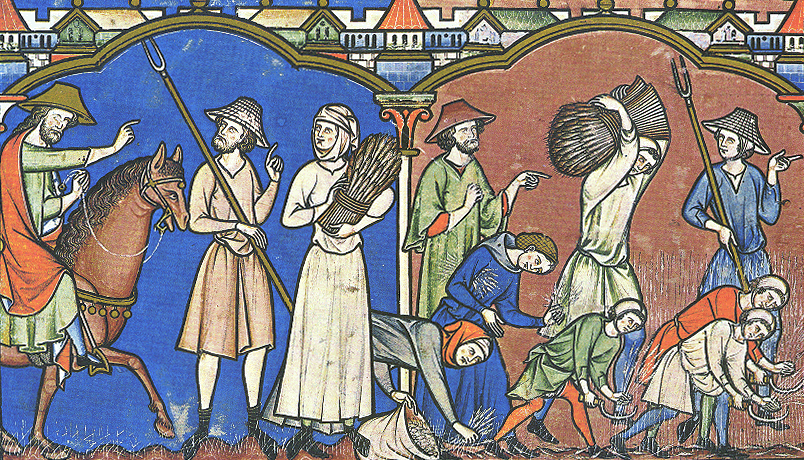
In Medieval times before the advent of the printing press most people relied on images in illustration, illuminated manuscript, and stained glass to visualize and communicate what is contained in written text. The illiterate and to those without access to copies of the source text had to rely on these visual interpretations to ascertain the truth. This is very similar to today's use of data visualization tools and infographics to help those who either are not good with numbers or who don't have access to the raw data to ascertain the truth. Each medium has a different set of affordances and range of expression. Information gained from an image contains information not gained from text or numbers. There are also limits to what visual representation can tell us. 

When we rely on visual interpretations to understand data, how can we be sure what we are seeing is not a distortion of the truth? How can we be sure we are not missing something important? How can we be sure we really understand the data? 


There is an old Hindu saying associated with the elephant-headed god Ganesh that says, "map is not territory" meaning that a map is an abstraction. It represents territory but is not itself the thing it depicts. René Magritte addressed this concept in his famous painting "The Treachery of Images" in 1928-1929. Below it, Magritte painted, "Ceci n'est pas une pipe" for "this is not a pipe." It certainly is not, it is a painting, an abstract representation of a pipe. There are many who have observed the abstract nature of a representational medium. The same is true with the written word.


In Medieval times very few people were privileged enough to either possess books or learn to read, that was reserved for clergy and those in power (kings, queens, noblemen, lords, etc.). The average peasant read pictures but the ultimate statement of truth was, "and so it is written." Today we say there is "truth in numbers" for the same exact reason. Phrases like, "research shows," or "polls indicate," or "according to statistics" carry the same weight and are used in exactly the same way people used to refer to the written word. And the reason for this is, with the exception of the privileged few who have both access to the sources of data we hear used on a daily basis to support this or that claim and who have the skill to read and interpret it, for most of us the raw data is just as much a mystery as the written word was to the average Medieval peasant.

Both written language and statistics are abstractions from the truth. The most common texts in Medieval times were religious texts and were regarded as having been delivered to mankind through the hand of God himself. Yet historically, we know the Bible is a collection of many books that once were separate and only came together when a Roman emperor (Constantine) called for church leaders to canonize some of the books so that he could use the Roman Catholic Church to unify a wavering Roman Empire. After the Council of Nicaea the written word was translated into Latin then used as a political tool to manipulate the public.


The New Testament books, and the ones that were left out of the cannon, were written by men (and some women) and most were historical accounts of the life of Jesus Christ. These documents are essentially abstractions. The book of Matthew is not the life of Jesus Christ but one man's written depiction rendered in the abstraction that is the written word. By Medieval times most people no longer spoke Latin yet churches insisted on conducting services in that language leaving hem to rely on visual interpretations of a Latin text that had already been translated once, whose original was, by the very nature of the medium, an abstraction from the reality of the content the original was trying to depict. With each translation and with each interpretation into a new medium there presents the opportunity to alter or distort the original message. In this time the church used the written word the same way Emperor Constantine used it...for social and political control and manipulation.

Today data is used with the same power and for the same purposes. Data is collected by those who wish to exact some influence or control over that which it is being collected on. Much like the selection of books at the Council of Nicaea, data becomes canonized by those who wish to use it to control or manipulate. We put faith in numbers because like the written word to the Medieval peasant we find raw data to be largely inaccessible but also magical. But, just a written account of the life of Jesus Christ is not the same thing as the actual life of Jesus Christ, and just as a map is not territory, I am not the sum of my data. The world represented through statistics is a make-believe world, an abstraction. And statistics interpreted visually are even further removed from the truth.

Tuesday, December 4, 2012

Creation as a Consumer of Participatory Media

As both a constructivist educator and as an art teacher I highly value endeavors that involve making, doing, and creating. Coming from that perspective as a technology integrationist I have done a lot to promote the use of technology tools both in schools and in people's personal lives that allow them to participate, make, interact, and produce. Through my Digital Backpack collection of free online tools I have introduced many teachers and students to wonderful tools that allow them to engage this way online. I have also been an strong advocate for engaging students as producers of content, not mere consumers (see: Transforming Students into Citizen Journalists, Has Social Media Become a Realm of the Haves Versus the Have-Nots?, and Engagement as Information Prosumers).  However, lately something has begun to bother me about all of these free online tools.

In my post yesterday I mentioned how if you search through the ISTE 2012 Conference sessions there were only 4 on teaching students to program but a ton of sessions that mention the word "create." I also mentioned that if you closely examine these session descriptions most of these "create" activities involve the kind of publication of information using tools like Facebook, WYSIWYG editors, Fickr, Twitter, Facebook, etc. Essentially, when you use these tools to create content you are "feeding the beast" because no matter what your content is, you are producing data. And, there is no shortage of free online tools that will help you visualize this data.


Essentially, we are back to McLuhan: "The medium is the message." It doesn't matter as much what we say on Twitter as it matters that we Tweet. Because, by Tweeting we are consuming. It doesn't matter as much what we say in a podcast as it matters that we podcast. It doesn't matter as much what we blog as it matters that we blog. And especially, it doesn't matter as much what we post on Facebook as that we post on Facebook.

Now there are a couple of issues here and I am not trying to argue that any of these tools are necessarily bad but I do think that a healthy awareness of these issues can help hold off some of the negative consequences.  Other negative consequences are unavoidable, they are the bargain we make when we engage in this medium to "create." First is what happens to and who owns the data we produce? We know, or at least we think we know, how Facebook has been using the data all of our engagement with it's platform is producing. They have been pretty open and honest about it. They use it to target us for marketing. Same with Google. Nothing new or groundbreaking there except that it promotes a certain kind of aggregated tribal lifestyle where we only come in contact with news, information, and products related to the content we post ourselves and that produced by our online connections.

Second is not as obvious and is an issue with tools both online and off which is the issue of artificial parameters. In The Cognitive Style of PowerPoint Edward R. Tufte (2003) makes a case for how the format of the slideware program PowerPoint is a problem for the sharing and presentation of information.  It is through PowerPoint's templates and limited set of tools that all information begins to take on the same format and essentially say the same thing.  This "cognitive style" in PowerPoint, coupled with the culture many corporations, organizations, and government agencies have developed of always using PowerPoint to share or disseminate critical information, eventually leads to a breakdown of information. All content contained within a PowerPoint takes a back seat to the format of PowerPoint. This is a major problem for probably 80% of the presentations that utilize the tool because, 
 "the metaphor behind the PowerPoint cognitive style is the software corporation itself. That is, a big bureaucracy engaged in computer programming (deeply hierarchical, nested, highly structured, relentlessly sequential, one-short-line-at-a-time) and in marketing (fast pace, misdirection, advocacy not analysis, slogan thinking, branding, exaggerated claims, marketplace ethics). To describe a software house is to describe the PowerPoint cognitive style."
With PowerPoint, all information in a presentation becomes infomercial.

The problem Tufte observes with PowerPoint holds true for every other medium but especially Web 2.0 tools.  Web 2.0 is often described as the time when form and content became separate. Before Web 2.0 one had to know how to design a web site, how to utilize an FTP program, and how to make folders on a server accessible to the World Wide Web if they were to put anything online. One had to know how to manage the form in order to publish the content. But with Web 2.0 you no longer need to know how to craft the form, you just take someone else's template and use it to publish your content. You allow Facebook, Blogger, Twitter, Flickr, Photobucket, Tumblr, Ning, etc. to define the parameters and you fit your content to these parameters thus restricting the range of what your content can express. By leasing control of form to these internet companies to some degree you hand over an aspect of the content as well. And, in this lease we become consumers, consumers of participatory media.

Monday, December 3, 2012

We Live in a Make-Believe World #edchat #iste2012 #ties12

I am more and more convinced that we live in a world of make-believe, a world of make-believe created by the media we use.

Six years ago I started a personal inquiry into why every time I built an art program at a school it was either cut or I was bumped out within two or three years. This journey took me to spending five years as a technology integration specialist, study of school policy, and intense research into the history of public schooling, particularly the history of trends in instructional methods and pedagogy. What I found was something quite troubling. In the past ten years Minnesota has lost over 50% of its fine arts FTEs in schools across the state. How can this be? Could there be other data and statistics out there that would point to the source of this problem?  I will come back to this point later.

Last summer it struck me. I have attended and presented at the ISTE Conference twice in the last three years and have followed it closely the years I could not attend.  This is the world's largest education technology conference. Now, when I was growing up the computer was a major influence on my intellectual development. I spent hours learning how to program video games and write code. Through writing code I learned algebra, logic, mechanics, and physics in an intensely immersive project-based authentic way. For me the most important aspect of this machine as a learning tool was what it provided as a medium of expression, of creativity, and of engagement. It brought math to life.  It also provided me a way to cope with my dysgraphia. But, of the 385 concurrent sessions offered at the 2012 ISTE Conference only four were about engaging students as computer programmers. FOUR! That is just 1% of the sessions at the world's largest education technology conference. What is going on here? For fun, and to illustrate a point, I created this infographic about last summers ISTE Conference:


1% of sessions at ISTE about programming and 50% of Minnesota's art teachers lost, could these statistics have a common root? I believe so. What I left out of this infographic is that when you search the ISTE conference site using the session keyword search engine the number of sessions with the word "create" appear far more than any of the examples I listed here. However, upon closer inspection of these sessions they are all examples of creation as a consumer of participatory media. When we create a web page using a WYSIWYG editor, when we build a Facebook page, when we upload photos to Flickr, when we make a podcast, when we click "like" on someone's status, when we click a link we are feeding the beast. All of these activities produce data.

In Marshal McLuhan's (1964) Understanding Media: The Extensions of Man McLuhan tells us that the "Medium is the Message," meaning that it matters less what content is contained in media than the effect a media has on us. In other words, the effect of the existence of television in our homes is greater than the effect of any content that may be delivered through it. A media has an effect of working us over, making us numb to its nature and leading us to shift our ways of thinking. McLuhan wrote this book at a time when Television was beginning to take over as the dominant media.

Twenty years later Neil Postman wrote Entertaining Ourselves to Death at a time when television had long since replaced newsprint and radio as the dominant media and McLuhan's observations were more apparent. Postman observed that when a society shifts its dominant media from one to another it also shifts what it values as sources of truth. Once it was that “feeling is believing” then “saying is believing” then “seeing is believing” then “reading is believing” then “deducing is believing” and now “counting is believing.” Postman argues that it is the media driven culture that has reduced our concept of what is believable data to that which can be counted, that which can be objectified and abstracted. I would argue that it is not the mass media of television or radio that did this, these are analog media but rather the emergence of the computer and digital media.

If you look to rhetorical arguments, campaign propaganda, and advertisements from the 1950s you see a different appeal than you do today. Not a day goes by where we are not inundated with data and statistics as a source to base our beliefs, change our minds, or influence actions but just 60 years ago the use of data and statistics was far less a part of our lives. Instead, the analog electric media of the time produced a belief system that relied on analog sources. A politician was more likely to use a "plain folk" argument or a clever play on words to sway a voter and the advertisements for products focused more on how a product would make you feel.


But today it is data that we look to for our source of truth. The role of data and data visualization have changed and evolved over time. We have become a data-obsessed culture to the point where if we make decisions that are not data-driven or data-informed we are looked to be foolish. In a staff meeting just a couple of months ago a colleague said, "How can you justify a decision like that without collecting data to back it up?" A statement like this is telling on two fronts.  First, it negates qualitative data and only focuses on that which can be quantified. Second, it implies that the decision has already been made and that the data we collect ought to back up our decision. This is not data-driven decision making, it is decision-driven data collection. But more times than not what is called data-driven decision making is really a rhetorical device used to justify decisions based on other factors.

The building blocks of digital media is data, it is digits, 1s and 0s and having moved to center stage in the past 10 years as the dominant media it has shifted publicly accepted sources of truth to that which can be quantified. If it can't be counted it is hard to justify it and it is hard for the meta-world created by the data we produce which overlays our real world to see it. Along with this new source of truth comes a charge and desire to "feed the beast;" to produce more and more data. Because, the more clearly the meta-data world represents aspects of our real world the easier it is to manipulate both. Hence the presence of so many sessions at ISTE asking teachers and students to "create" but so few asking them to "program." And, because there is no data-collection method used to evaluate the effectiveness of Minnesota's arts programs many of them get left out of the data-driven decision process. How can you make a decision to keep a program when the law of the land (NCLB) asks you to make decisions based upon data you have collected. Data that is easily quantifiable. But, make a standardized test to evaluate student achievement in the fine arts and you kill it.


I say we are living in a make-believe world. The data=truth pandemic is a grand illusion. This world overlays our real world and we tap into it all the time. Today with a smartphone and an augmented reality app you can scan your neighborhood and access data about physical places and soon you will be able to access data about people. QR codes give us access to the meta-data world associated with objects around us. There have even been calls to create a game layer over the real world. These tools all give us more information that are supposed to help us make decisions but what do they leave out? Are there things in our real world that cannot be digitized or datafied? Are there things that will not make it into the meta-world.  And, when we rely on the meta-world for our source of truth what happens to those things that don't make it there?


The big problem is not that data cannot represent aspects of truth. It can. But it can never represent all aspects of truth.  It is by nature an abstraction and massive amounts of data rely on visualization techniques to make sense of it.  A data visualization is a further abstraction one step more removed from the truth. The more we work with abstraction the more we can manipulate the interpretation of truth. Truth in data becomes truth crafted by interpretation of data which becomes truth crafted by design. Nowhere is this more evident than in the emergence of infographics.

If I gave you a statistic that said homeowners increased their spending on entertainment 11% between 1986 and 2010 you probably wouldn't pay it much mind. But, if I accompanied that statistic with picture of an overweight guy in a stained tank top slumping on a couch watching television and eating potato chips you would interpret that data infusing it with negative associations. However, if I instead accompanied that data with an image representing ballet, the theater, or the symphony it takes on a new interpretation. Data can be manipulated without changing the data.

Marshal McLuhan was cautiously optimistic that if we understand the nature of media we can avoid many of the negative effects it brings. If we understand the nature of the beast we can keep it at bay.  At the same time he observed that, "First we craft our tools then our tools craft us," leaving the possibility that it matters not how much we understand the nature of the media, it will likely have its effect anyway.


Friday, November 30, 2012

TIES Conference 2012 - Shameless Self-Promotion


The annual TIES conference is coming up soon and I have been relentlessly preparing my workshops and sessions.  This year I will be presenting three pre-conference workshops and two general sessions.  I am real excited because two of these topics are ones that I have been proposing for a few years now and now are finally accepted.  If you are attending I hope to see you there.

My Pre-Conference Workshops:


My General Sessions

Monday, August 27, 2012

What Do You Want To Learn?

I started a new adventure today. Last June my position was cut at the charter school I worked for for one year. So, after spending most of the summer searching for a new job I landed a pretty cool gig and started today. After being mostly out of the classroom for five years working as a technology integration specialist and technology coordinator I returned to work today as an art teacher at the Perpich Center.

Back when I started my career twelve years ago I visited this place a couple of times and fell in love with it. It is the only state-run high school in Minnesota. It only serves 11th and 12th graders and all students have to go through a rigorous application process to attend. About half of the students live on campus in a residence hall and the other half are commuters. Every student who attends this school is uniquely devoted to one or more disciplines within the arts. In many ways this is my dream job but it is definitely not what I expected to be doing this year.

Five years ago when my full-time ALC art position in Fridley, MN was cut I shifted careers and began my work in education technology. At that point I didn't realistically think I would be offered the chance to teach art again. In fact, most of the job interviews I went on this summer were for education technology jobs. So, I was very surprised and delighted to be asked to interview for what once was, and in many ways still is, my dream job. I think this means that I will be coming out of exile as an art teacher.

Now, this new position is not without its glitches. This school is over an hour and a half from my house so my daily commute will be quite a bit longer than I have been used to. This is also technically only a one-year position filling in for a staff member who is on leave so it is hard to justify moving at this point. I will have to wait and see. Also, what I teach exactly is still being decided. My schedule is kind of amorphous but I do know that I will be the visual arts gallery coordinator. I will also teach an animation class this term and a sculpture class later in the year. What else I teach will be determined as the year progresses.

Today was our first day and was basically just orientation for new students (and for me). Tomorrow will be the first time I really get to meet with my animation students for regular class. I have no syllabus yet. I have very little idea what supplies or tools I will have to work with. I also want to take what the kids want to get out of the class in consideration when laying out a course framework. So, I've decided that I will start the class off tomorrow by showing this video:

What Do You Want To Learn? from Carl Anderson on Vimeo.


The first project will be for the students to create their own curriculum board together but to animate it's creation. It is my intention that this will be at least a one-week project and a great introduction to stop-motion animation. It will also be a great community building activity and give me a good idea of how to tailor the course to meet their needs. When the students complete their curriculum board animation project I will upload and share it.

Tuesday, July 3, 2012

Twitter Book Club: Gerald W. Bracey (2009) Education Hell: Rhetoric vs. Reality–Transforming the Fire Consuming America's Schools


Ch1: Pre-Sputnik: Non-Test-Based Criticism of Schools


Ch2: Post-Sputnik: Criticisms and the Descent Into Test Mania


Ch 3: Tests: Descriptions and Trends—How Do We Measure Up?


Ch 4: No Child Left Behind: "The Beatings Will Continue Until Morale Improves"


Ch5: Science, Engineering, and Economic Competitiveness


Ch 6: The Real Meaning of Competition


Ch 7: "Poverty is Poison"


Ch 8: A Few Words About Learning—Eureka


Ch 9: The Goals of Public Education


Ch 10: The Lost Lessons of the Eight-Year Study


Ch 11: Democracy and Education